Speed analysis dashboard shows page load and content speeds and which loading time is affecting the user journey.

Speed Analysis

Speed matters - Improve site performance for conversion and SEO

Monitor Core Web Vitals for users and proactively check performance. See the impact of performance on conversions, bounce rate and other business outcomes. Go deep to understand the root cause of web performance issues.

Key Features

icon human clock Real User Monitoring

Track Core Web Vitals across your site

With Contentsquare Speed Testing & Monitoring, you can monitor Core Web Vitals and other key performance metrics across your site so you can quickly take action to improve speed, minimize errors, and improve experience.

Customer Stories

Contentsquare helps Specsavers increase website speed and achieve a 33% boost in conversion rate

Read more from Specsavers View all case studies
"
Before Contentsquare, we had no way of tying together website performance metrics like Core Web Vitals and conversion. With Contentsquare, we’re now able to make decisions based on data, and see the direct, quantifiable impact of changes on our customer behavior."

James Saukinsey

Global Head of Digital Analytics and Technical SEO

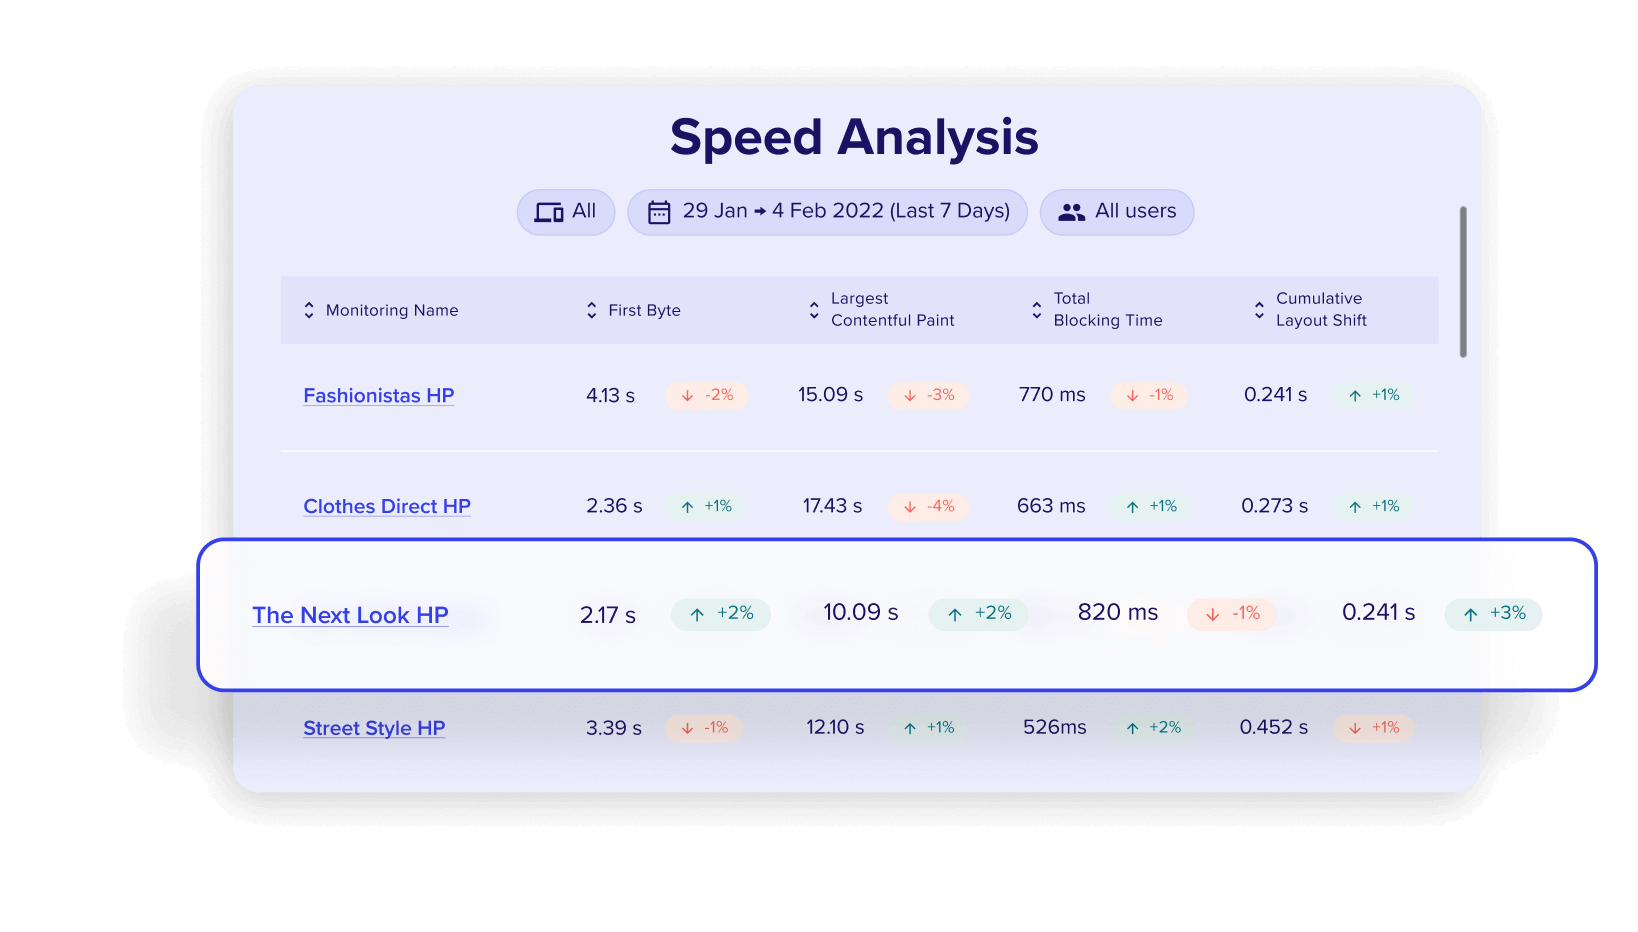
Discover the power of Speed Analysis

  • Fast 100 Report

    Blog

    Contentsquare launches Fast 100 ranking using Speed Analysis tool

    The Fast 100 report ranks the website performance of the 100 most popular retail brands in the UK, measuring speed, usability and responsiveness.

  • eBook

    How to improve your website performance

    In this guide, we cover the key metrics (CWV and otherwise) that you need to be tracking and present 55+ actionable insights to optimize your web performance.

  • website-experience-users-table

    blog

    Website Experience: How to Optimize for User Satisfaction

    Optimize your website experience through improved navigation, design, and quality content, SEO optimization, and conversion rates.

Interested in a Speed Analysis Demo?

Get a demo

Frequently Asked Questions

  • Website performance monitoring involves tracking and analyzing various metrics to ensure a website's optimal functioning. It is crucial for online businesses to maintain a positive user experience and identify and address issues promptly.

  • Commonly monitored KPIs include page load times, server response times, uptime, error rates, and overall website availability. These metrics provide insights into the health and performance of a website.

  • Neglecting website performance monitoring can lead to slower load times, increased downtime, higher bounce rates, and a negative impact on search engine rankings. This can result in a loss of potential customers and revenue.

  • By identifying and addressing performance issues promptly, website performance monitoring helps ensure a seamless and fast user experience. This, in turn, enhances user satisfaction, reduces bounce rates, and contributes to higher user retention.

  • Core Web Vitals are a set of three specific metrics that measure the real-world user experience for loading performance, interactivity, and visual stability of the page. Largest Contentful Paint (LCP) measures loading performance. It is the time it takes for the largest content element on the page to load. Interaction to Next Paint (INP) measures user interface responsiveness, in other words quickly a website responds to user interactions like clicks or key presses. Cumulative Layout Shift (CLS) measures visual stability. It is the amount of unexpected layout shift that occurs on the page during loading. Each Core Web Vital metric has an established range for what constitutes good, needs improvement and poor performance. In addition to being an important factor for SEO, improving Core Web Vitals can also lead to benefits such as increased user engagement, higher conversion rates and reduced bounce rates.

  • In 2020, Google announced that Core Web Vitals would become a ranking factor in its search results starting in May 2021. This means that websites with good Core Web Vitals are more likely to rank higher in search results than websites with poor Core Web Vitals.

  • Many studies have shown that web performance strongly correlates to key user experience metrics, including conversion rate, engagement and bounce rate. For example: Vodafone found that a 31% improvement in Largest Contentful Paint (LCP) increased sales by 8%. Google found abandonment for mobile users increased by 53% if a website takes more than three seconds to load. Walmart found that for every one second increase in load time conversion rates decreased by 2%. A recent analysis of billions of sessions from Contentsquare’s own customer data found: Higher INP leads to higher frustration, with frustration rates ranging from 33% to 38%. Retailers with good INP have a 25% higher conversion rate on average than those with INP in the ‘poor’ or ‘needs improvement’ range. Bounce rates increase by over 10% for websites with poor INP compared to those with good INP.

  • Synthetic Monitoring is a proactive lab testing approach to monitoring the performance and functionality of a website or web application. It uses simulated user interactions to test the website from different device types and locations around the world. This allows you to identify and fix performance issues before they affect real user Synthetic monitoring solutions work by sending automated requests to your website or web application. These requests can simulate a variety of user interactions, such as: Loading the homepage Logging in Searching for products Adding items to a shopping cart Completing a purchase The monitoring solution then tracks the response time and success rate of each request. If any of the requests fail or take too long to respond, the solution can alert you so that you can investigate the issue. Synthetic monitoring can be used to monitor a variety of different metrics, including: Uptime and availability Page load speed Transaction success rate API performance Error rates Core Web Vitals

  • Real user monitoring (RUM) collects detailed data about user interactions with a website or application. RUM collects data on a variety of metrics, such as: Page load times First contentful paint Interaction to Next Paint DOMContentLoaded event time Load time of individual resources (e.g., images, CSS, JavaScript) User errors User clickstream data RUM data can be used to identify and troubleshoot performance bottlenecks, optimize user experience, and understand how users are interacting with the application. With RUM, Contentsquare can correlate performance issues with their impact on conversion so teams can prioritize what to fix first. RUM is a passive monitoring technique, meaning that it does not require any active interaction from the user. Instead, RUM data is collected by a small piece of JavaScript code that is embedded in the application or website. This code collects data about the user's interaction with the application and sends it to a RUM server. RUM is a valuable tool for any organization that wants to improve the user experience of its applications. By understanding how users are interacting with their applications, organizations can make informed decisions about how to optimize performance and improve the user experience.

Can’t find what you are looking for?